AI Services

Data Analytics & Business Intelligence

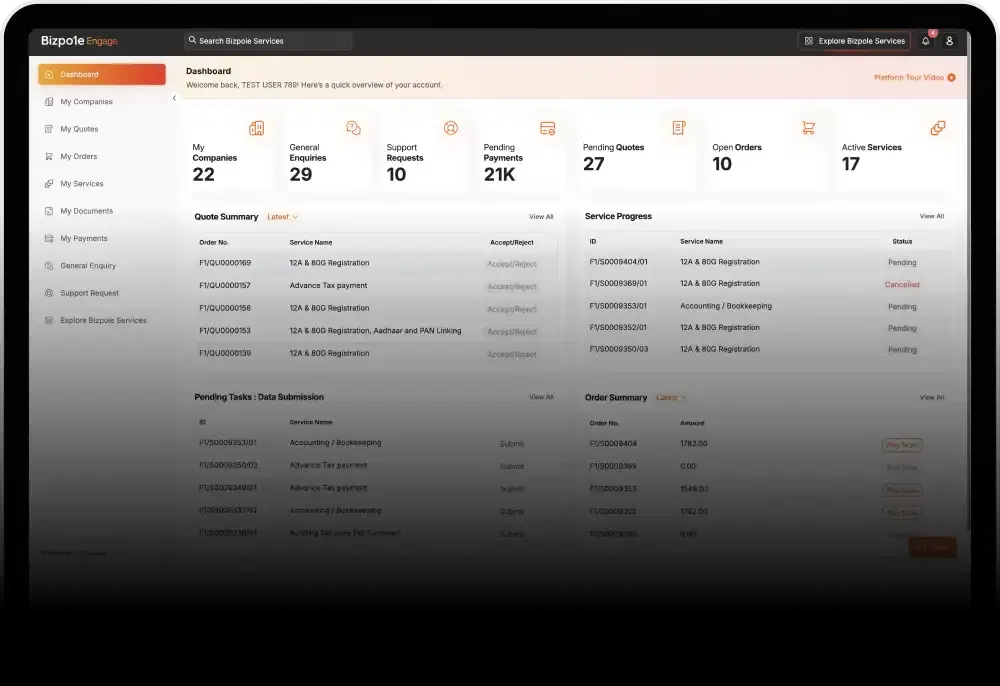
Data analytics and business intelligence work only matters once decisions actually change because of it — not when a new dashboard simply restates what a spreadsheet already showed. Quinoid's India-based data teams start by identifying the three or four decisions your leadership team makes regularly — pricing, inventory, hiring, churn response — and build the data pipeline and reporting layer backward from those decisions, rather than building a generic dashboard first and hoping someone finds a use for it. We consolidate data scattered across your CRM, ERP, product analytics, and spreadsheets into a single modeled warehouse, then build reports that surface the specific metric thresholds that should trigger action. For companies turning operational data into decisions, the technical work — ETL pipelines, data modeling, warehouse selection — matters less than this discipline of starting from the decision and working backward, because that's what determines whether the resulting dashboard gets checked weekly or abandoned within a month like most first-attempt BI projects.

Where This Applies

Consolidating fragmented data into a single reporting source

CRM, ERP, product analytics, and spreadsheet data get pulled into one modeled warehouse, replacing the manual cross-referencing teams currently do across five different tools to answer one question.

Decision-triggering dashboards for recurring leadership reviews

We build dashboards around the specific metrics that should trigger a pricing, inventory, or staffing decision, with thresholds and alerts, not just historical charts to scroll through.

Customer and revenue cohort analysis

Retention, churn, and lifetime-value patterns get broken down by cohort and segment, surfacing which customer groups are actually driving growth or risk rather than relying on blended averages.

Operational forecasting from historical transaction data

Demand, cash flow, or staffing needs get forecast from your existing historical transaction and operations data, feeding directly into planning cycles instead of a separate manual estimate.

Business Outcomes

01

Clearer visibility into business performance

02

Faster decisions backed by reliable reporting

03

Less dependency on manual spreadsheet reporting

Why Quinoid

We build reporting backward from the decisions it needs to inform, not forward from whatever data happens to be easiest to pull. That discipline is why our dashboards get checked weekly instead of joining the pile of unused BI tools most companies accumulate.

  • We map the specific recurring decisions a dashboard needs to inform before designing a single chart or metric.
  • Every metric is validated against numbers your finance or ops team already trusts, catching modeling errors before launch.
  • We track post-launch usage and revise dashboards based on whether leadership actually checks them, not just at handoff.

Delivery Process

01

Decision mapping before any dashboard design

We identify the specific recurring decisions leadership makes and what data would actually change those decisions, before any reporting work starts.

02

Data consolidation and warehouse modeling

We pull data from your CRM, ERP, and other systems into a single modeled warehouse, resolving the inconsistent definitions that usually cause conflicting numbers across teams.

03

Dashboard build around decision thresholds

Reports are built around the specific metric thresholds that should trigger action, with alerts for when a number crosses that threshold rather than passive historical charts.

04

Validation against known historical outcomes

We validate new reports against numbers your finance or ops team already trusts from past periods, catching modeling errors before the dashboard goes live.

05

Adoption support and iteration

We track whether the dashboard actually gets used in recurring leadership reviews and adjust the metrics and layout based on real usage, not a one-time handoff.

Proof in Production

Frequently Asked Questions

Our data lives in five different tools. Can you work with that?

Yes, that's the typical starting point. We consolidate CRM, ERP, product analytics, and spreadsheet data into a single modeled warehouse rather than requiring you to migrate systems first.

How is this different from just buying a BI tool license?

A BI tool is just the visualization layer. The harder, more valuable work is the data modeling and decision mapping underneath it, which determines whether the resulting dashboards actually get used.

Can you build forecasts, not just historical reporting?

Yes, we build operational forecasts for demand, cash flow, or staffing from your historical transaction data, feeding directly into planning cycles rather than producing a separate static report.

What if different teams already report conflicting numbers for the same metric?

That's a common starting issue, usually caused by inconsistent definitions across source systems. We resolve those definitions during warehouse modeling so every team reports from the same validated source.